Earth Day
One of the most interesting projects I worked on during my university years was one
concerning climate change. Data Science applications are massively helping the fight
against climate change. In addition to climate models, machine-learning solutions have
been developed to predict climate behavior in the future.
However, this project focused on data management and visualization techniques.
My team and I selected 36 countries presenting specific characteristics related to
environment and climate change to be analyzed. We chose the 24 countries that joined
Annex II a subcategory of the Kyoto Agreement. Three countries from the BRICS (we had
to discard Russia and China because of Twitter limitations) and 10 countries that are
active in the fight against climate change.
Firstly, we gathered data from different sources. From the Word Bank website,
we extracted information about the socioeconomic situations of these countries.
From the official website of the Environmental Performance Index, we retrieved some
of the major indicators concerning climate and the environment. We created a single
dataset merging all the information gathered.
Then we streamed tweets from the countries
selected during World Earth Day making use of Tweepy and Kafka. The streaming was performed by
filtering by hashtags. We chose words such as #earhday, #climatechange, and #plasticfree.
All these patterns were translated into multiple languages to reach a greater number of tweets.
After some preprocessing concerning the language translation and country identification, we applied
Sentiment Analysis to extract the feelings of each population. In the end, we integrated the result
into the main dataset.
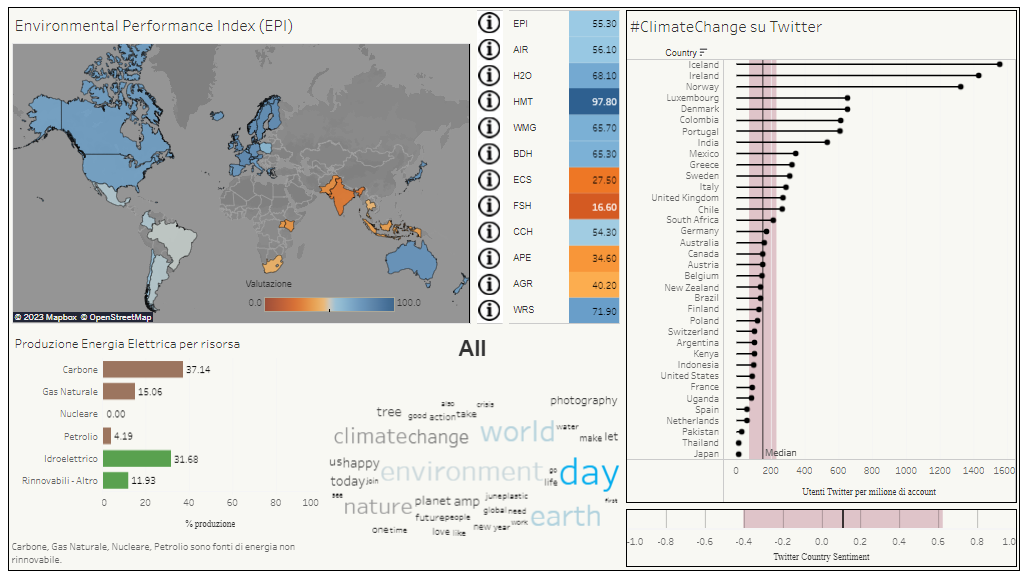
When the data was ready, we started to explore and analyze it
creating visual representations making use of Python and Tableau.
The final dashboard is available here while the notebook used for every single step is posted
on my GitHub page.